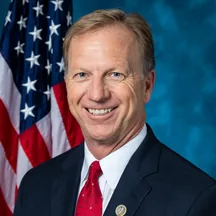
Kevin Hern portfolio
RepublicanIn office
House of Representatives · Oklahoma · 1,058 trades
- 1,058
- Trades
- Latest filing
- HD
- Most traded
Updated October 28, 2026 · Source: Clerk of the House
Short answer: At the end of 2025, Kevin Hern had 110 positions in stocks and options, reported together at up to $38.5M. The 2 largest are Raytheon Technologies and Williams Companies, each reported at up to $5.3M.
All of Kevin Hern's positions
| Stock | Sector | Amount | Latest transaction |
|---|---|---|---|
 RTXRaytheon Technologies Corporation | up to $5.3M | Purchase | |
 WMBWilliams Companies, Inc. | up to $5.3M | Purchase | |
 GOOGLAlphabet Inc. (Class A) | Communication Services | up to $1.5M | Purchase |
 DVNDevon Energy Corporation | up to $1.3M | Sale | |
 JPMJP Morgan Chase & Co. | up to $1.3M | Purchase | |
 ROKRockwell Automation, Inc. | up to $1.3M | Partial sale | |
 TXNTexas Instruments Incorporated | up to $1.3M | Partial sale | |
 EMREmerson Electric Company | up to $1.1M | Partial sale | |
 ORLYO'Reilly Automotive, Inc. | up to $1.1M | Partial sale | |
 COSTCostco Wholesale Corporation | up to $1M | Purchase | |
 ACNAccenture plc (Class A) Ordinary Shares | up to $1M | Sale | |
 HDHome Depot, Inc. | up to $765K | Sale | |
 AMZNAmazon.com, Inc. | Consumer | up to $750K | Sale |
 CDNSCadence Design Systems, Inc. | up to $750K | Partial sale | |
 OKEONEOK, Inc. | up to $750K | Exchange | |
 BSXBoston Scientific Corporation | up to $750K | Sale | |
 ICLRICON plc - Ordinary Shares | up to $600K | Partial sale | |
 LINLinde plc Ordinary Share | up to $600K | Partial sale | |
 LMTLockheed Martin Corporation | up to $600K | Partial sale | |
 NEENextEra Energy, Inc. | up to $600K | Sale | |
 CBChubb Limited | up to $515K | Sale | |
 MMCMarsh & McLennan Companies, Inc. | up to $515K | Purchase | |
 VVisa Inc. | Financials | up to $550K | Sale |
 MSFTMicrosoft Corporation | Technology | up to $500K | Partial sale |
 PWRQuanta Services, Inc. | up to $500K | Purchase | |
 AAPLApple Inc. | Technology | up to $500K | Partial sale |
 XOMExxon Mobil Corporation | up to $500K | Partial sale | |
 DHRDanaher Corporation | up to $350K | Partial sale | |
 PHParker-Hannifin Corporation | up to $350K | Sale | |
 PTCPTC Inc. | up to $350K | Sale | |
 IQVIQVIA Holdings, Inc. | up to $330K | Sale | |
 ITWIllinois Tool Works Inc. | up to $300K | Sale | |
 TJXTJX Companies, Inc. | up to $250K | Sale | |
 ABBABB Ltd | up to $250K | Purchase | |
 ASMLASML Holding N.V. - New York Registry Shares | up to $250K | Partial sale | |
 CMICummins Inc. | up to $250K | No trade since 2018 | |
 FCXFreeport-McMoRan, Inc. | up to $250K | Purchase | |
 CVXChevron Corporation | up to $250K | Partial sale | |
 BLKBlackRock, Inc. | up to $200K | Sale | |
 TMOThermo Fisher Scientific Inc | up to $200K | Sale | |
 PRGSProgress Software Corporation | up to $150K | Sale | |
 CLColgate-Palmolive Company | up to $130K | Partial sale | |
 AIOVirtus AllianzGI Artificial Intelligence & Technology Opportunities Fund Common Shares | up to $115K | Sale | |
 KOCoca-Cola Company | up to $115K | Purchase | |
 LOWLowe's Companies, Inc. | up to $115K | Partial sale | |
 PGProcter & Gamble Company | up to $115K | Sale | |
 ADBEAdobe Inc. | up to $100K | Partial sale | |
 AMPAmeriprise Financial, Inc. | up to $100K | Sale | |
 CORCencora, Inc. | up to $100K | No trade since 2018 | |
 CRCrane Co. | up to $100K | Sale | |
 CSCOCisco Systems, Inc. | up to $100K | No trade since 2018 | |
 HONHoneywell International Inc. | up to $100K | Sale | |
 ICEIntercontinental Exchange Inc. | up to $100K | Sale | |
 INTCIntel Corporation | Technology | up to $100K | Sale |
 JNJJohnson & Johnson | up to $100K | Sale | |
 MRKMerck & Company, Inc. | up to $100K | No trade since 2018 | |
 MUABlackrock MuniAssets Fund, Inc | up to $100K | Sale | |
 PLDProLogis, Inc. | up to $100K | Sale | |
 TROWT. Rowe Price Group, Inc. | up to $100K | Sale | |
 UNHUnitedHealth Group Incorporated | up to $100K | Sale | |
 WMTWalmart Inc. | up to $100K | Partial sale | |
 MDTMedtronic plc. Ordinary Shares | up to $100K | Sale | |
 BABoeing Company | up to $65K | Sale | |
 CMCSAComcast Corporation (Class A) | Communication Services | up to $65K | Sale |
 CTRACoterra Energy Inc. | up to $65K | Exchange | |
 BDXBecton, Dickinson and Company | up to $50K | Sale | |
BOKFBOK Financial Corporation | up to $50K | No trade since 2018 | |
 CNPCenterPoint Energy, Inc | up to $50K | Sale | |
 CSXCSX Corporation | up to $50K | Partial sale | |
 CTSHCognizant Technology Solutions Corporation (Class A) | up to $50K | Sale | |
 DISWalt Disney Company | Communication Services | up to $50K | Sale |
 ETNEaton Corporation, PLC Ordinary Shares | up to $50K | Partial sale | |
 FBNDFidelity Total Bond ETF | up to $50K | Partial sale | |
HCNWelltower Inc. | up to $50K | No trade since 2018 | |
 IVZInvesco Ltd | up to $50K | Sale | |
 NKENike, Inc. | up to $50K | Partial sale | |
NUMGNuveen ESG Mid-Cap Growth ETF | up to $50K | No trade since 2018 | |
 NVONovo Nordisk A/S | up to $50K | Sale | |
 NVSNovartis AG | up to $50K | Sale | |
 OGEOGE Energy Corp | up to $50K | No trade since 2018 | |
 PBAPembina Pipeline Corp. Ordinary Shares | up to $50K | Sale | |
 PSXPhillips 66 | up to $50K | Sale | |
 SBUXStarbucks Corporation | up to $50K | Sale | |
 STESTERIS plc | up to $50K | Sale | |
 STXSeagate Technology PLC - Ordinary Shares | up to $50K | Partial sale | |
 VUZIVuzix Corporation | up to $30K | Sale | |
 ALCAlcon Inc. Ordinary Shares | up to $15K | Sale | |
 ARKKARK Innovation ETF | up to $15K | No trade since 2018 | |
 BIIBBiogen Inc. | up to $15K | Sale | |
 BUDAnheuser-Busch Inbev SA Sponsored ADR | up to $15K | Sale | |
 CARRCarrier Global Corporation | up to $15K | Sale | |
 DEODiageo plc | up to $15K | Sale | |
 DIALColumbia Diversified Fixed Income Allocation ETF | up to $15K | Purchase | |
 ELEstee Lauder Companies, Inc. | up to $15K | Sale | |
 ETVEaton Vance Corporation Eaton Vance Tax-Managed Buy- Write Opportunities Fund Common Shares of Benefi | up to $15K | Sale | |
 EXASExact Sciences Corporation | up to $15K | Sale | |
 FFord Motor Company | up to $15K | Sale | |
FCOMFidelity MSCI Communication Services Index ETF | up to $15K | No trade since 2018 | |
 FDISFidelity MSCI Consumer Discretionary Index ETF | up to $15K | Purchase | |
FEMSFirst Trust Emerging Markets Small Cap AlphaDEX Fund | up to $15K | No trade since 2018 | |
 FQALFidelity Quality Factor ETF | up to $15K | Purchase | |
 FRELFidelity MSCI Real Estate Index ETF | up to $15K | No trade since 2018 | |
FUTYFidelity MSCI Utilities Index ETF | up to $15K | No trade since 2018 | |
GPSGap, Inc. | up to $15K | No trade since 2018 | |
 HRLHormel Foods Corporation | up to $15K | Sale | |
 KMBKimberly-Clark Corporation | up to $15K | Sale | |
 MDLZMondelez International, Inc. (Class A) | up to $15K | Sale | |
 OGNOrganon & Co. | up to $15K | Sale | |
 OTISOtis Worldwide Corporation | up to $15K | Sale | |
 VFCV.F. Corporation | up to $1K | Sale |
What members say
From 16,781 filings to 221
16,781congressional trades reported in the past 1.5 years
Experienced traders on our team check every trade
221shared with members since March 2025
Less than 1.5% of filings make the cut.
We check every filing. You get the trades worth acting on.
In the app you only see the trades our team selects after checking them, explained in plain language.
Join now →4.7 Trustpilot (310)4.8 Whop (330)5,000+ members
Other politicians












Frequently asked questions
Questions about Kevin Hern
What stocks does Kevin Hern own?
According to the annual report for 2025, Kevin Hern has 110 stock positions. The largest are Raytheon Technologies and Williams Companies.
How do you estimate the value of Kevin Hern's portfolio?
A filing gives no exact amount per position, only an upper bound, for example up to $25M. So we show that upper bound for each position. Together the positions are reported at up to $38.5M. Only for the split by sector do we use the midpoint.
What is the difference between Kevin Hern's portfolio and trades?
The portfolio is the position at one moment: the end of 2025, from the annual report for 2025. Trades are the purchases and sales, which must be reported within weeks. What was bought or sold after that is in Kevin Hern's stock trades.
Where does Wolf of Washington get its data?
Wolf of Washington builds and maintains its own database of stock trades by members of Congress: more than 102,000 trades by more than 350 members of Congress, from 2012 through October 28, 2026, updated every business day.
Every trade on a politician page is checked against the official filing with the Clerk of the House or the Senate. Funds, options, bonds and exchanges, which databases often miss, are taken from that filing.
From all those trades, experienced traders on our team pick the ones worth acting on. Of the 16,781 congressional trades reported in the past 1.5 years, we shared 221 with members since March 2025.
The positions come from the annual report for 2025, filed June 25, 2026. Trades after that are not included; they are under the overview.
For each position we show the upper bound of the reported amount. Only for the split by sector do we use the midpoint of each amount class.
An open upper bound, such as "Over $50 million", has no upper limit: we count it as its lower bound and call it a minimum.
Source: the annual financial disclosure report filed with the Clerk of the House.
Information only, not investment advice. Past performance does not guarantee future results. All figures come from public filings by members of the U.S. Congress; amounts are estimates based on the reported ranges.